Viridian · Case study
Maintenance Systems & Analytics
Connecting maintenance activity, asset records and engineering decisions.
Experience In Practice
Skills Applied
Technical Skills
Soft Skills
Start With The Maintenance Process
Maintenance data begins with real activity: an asset needs attention, a work order is raised, a spare is used or preventive work is scheduled. Reporting becomes useful when those records are organised around the equipment and processes they describe.
I led the MEX CMMS rollout across Viridian sites, working with assets, work orders, spare parts, preventive-maintenance schedules and user training. This combined system setup with the practical work of helping people use it.
Turn Records Into A Connected Model
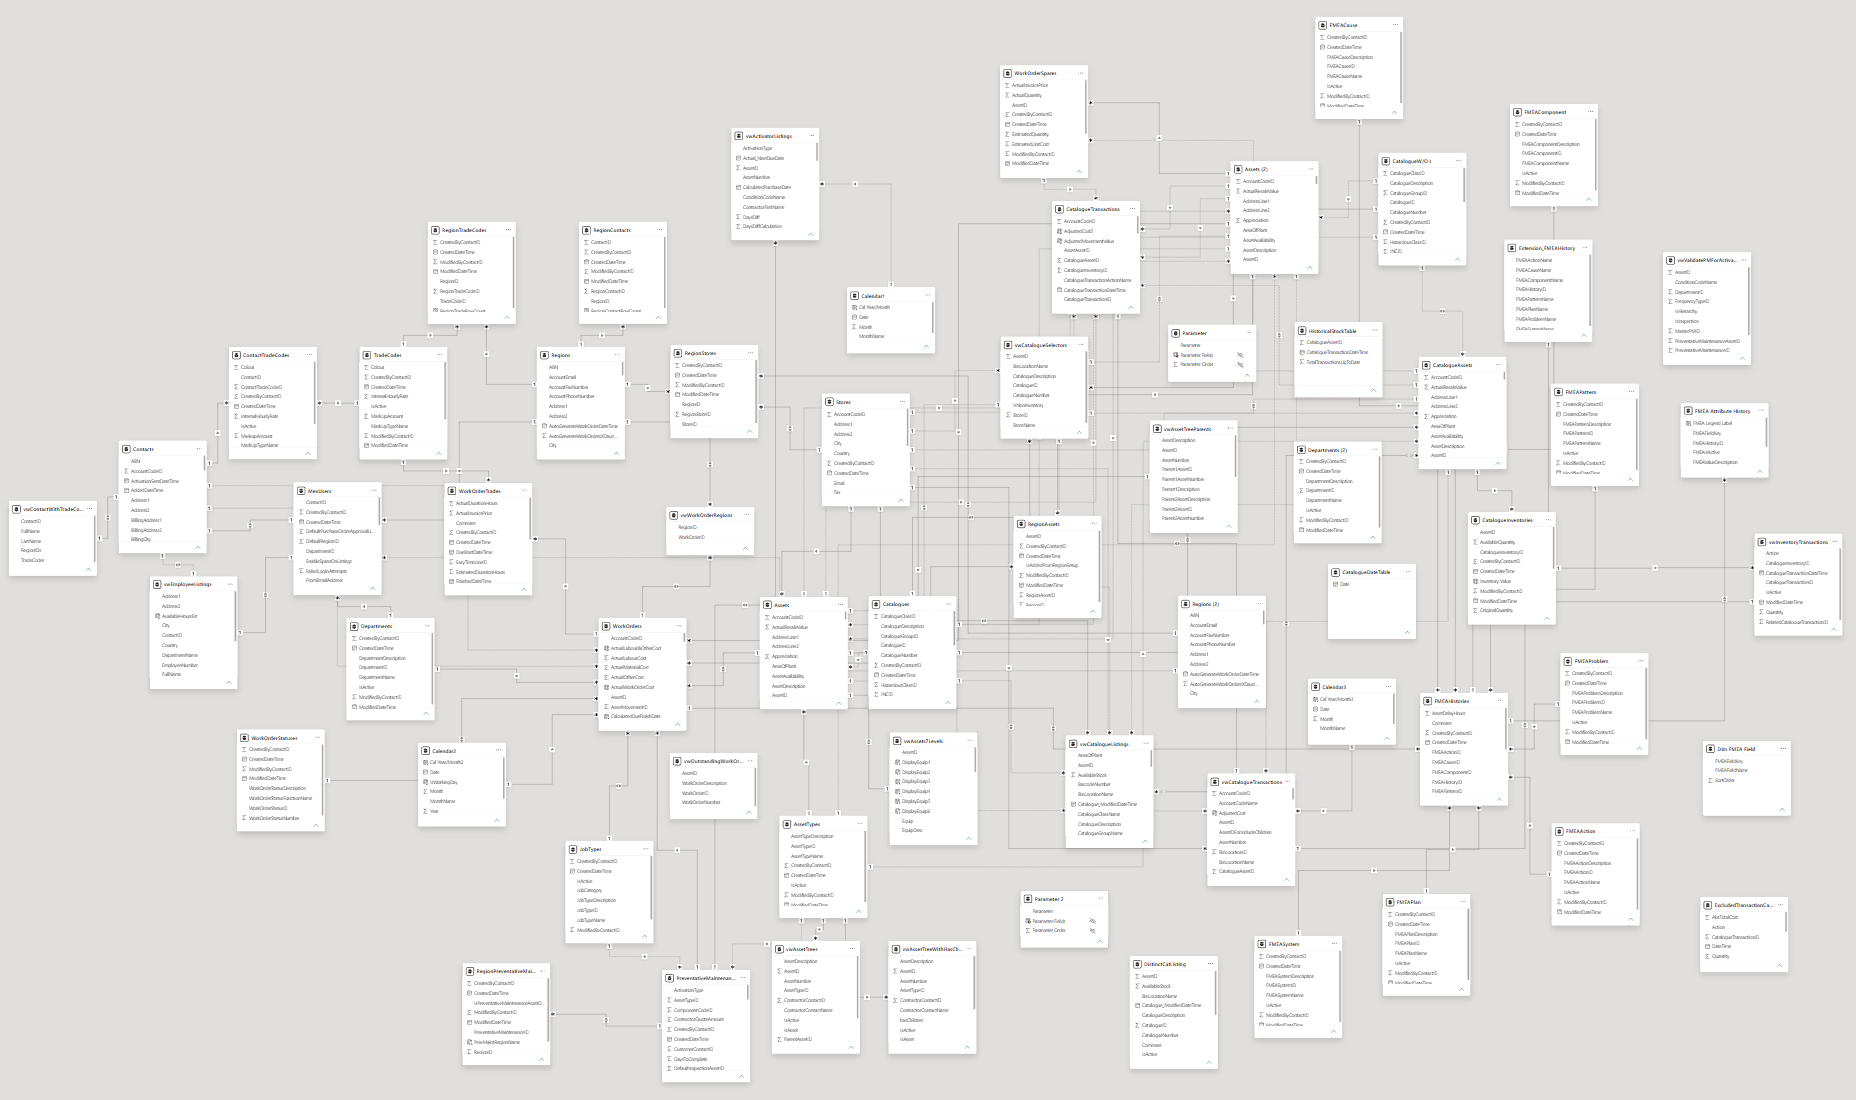
I developed live Power BI reporting from MEX using OData, Power Query and DAX, with SQL and Snowflake also part of the reporting work. The source evidence includes both dashboard views and a relational-model view.
The analytical work brings equipment, maintenance activity and time together, allowing the same operational information to be examined from several perspectives.
Design Around Engineering Questions
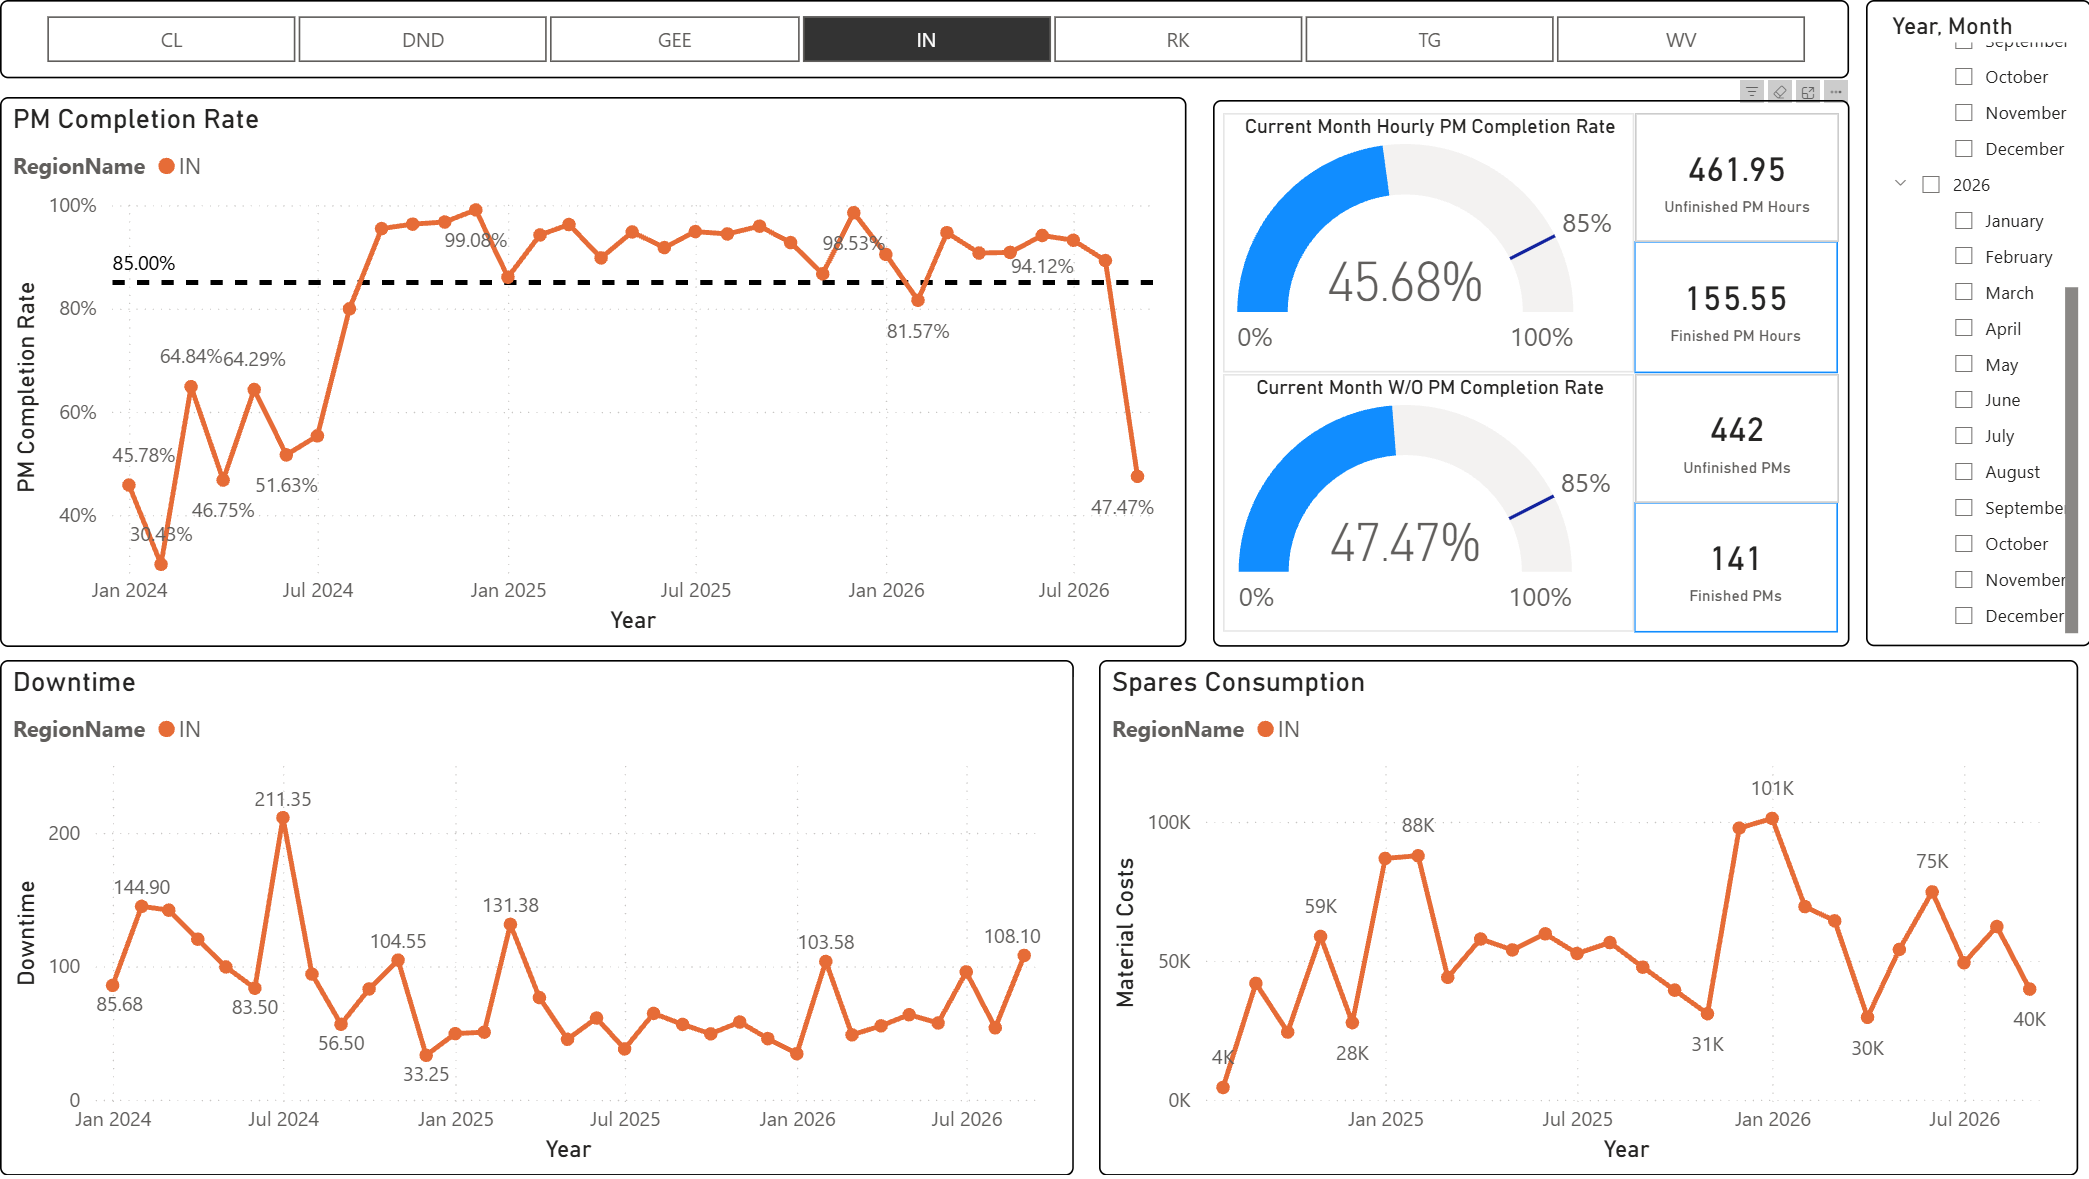
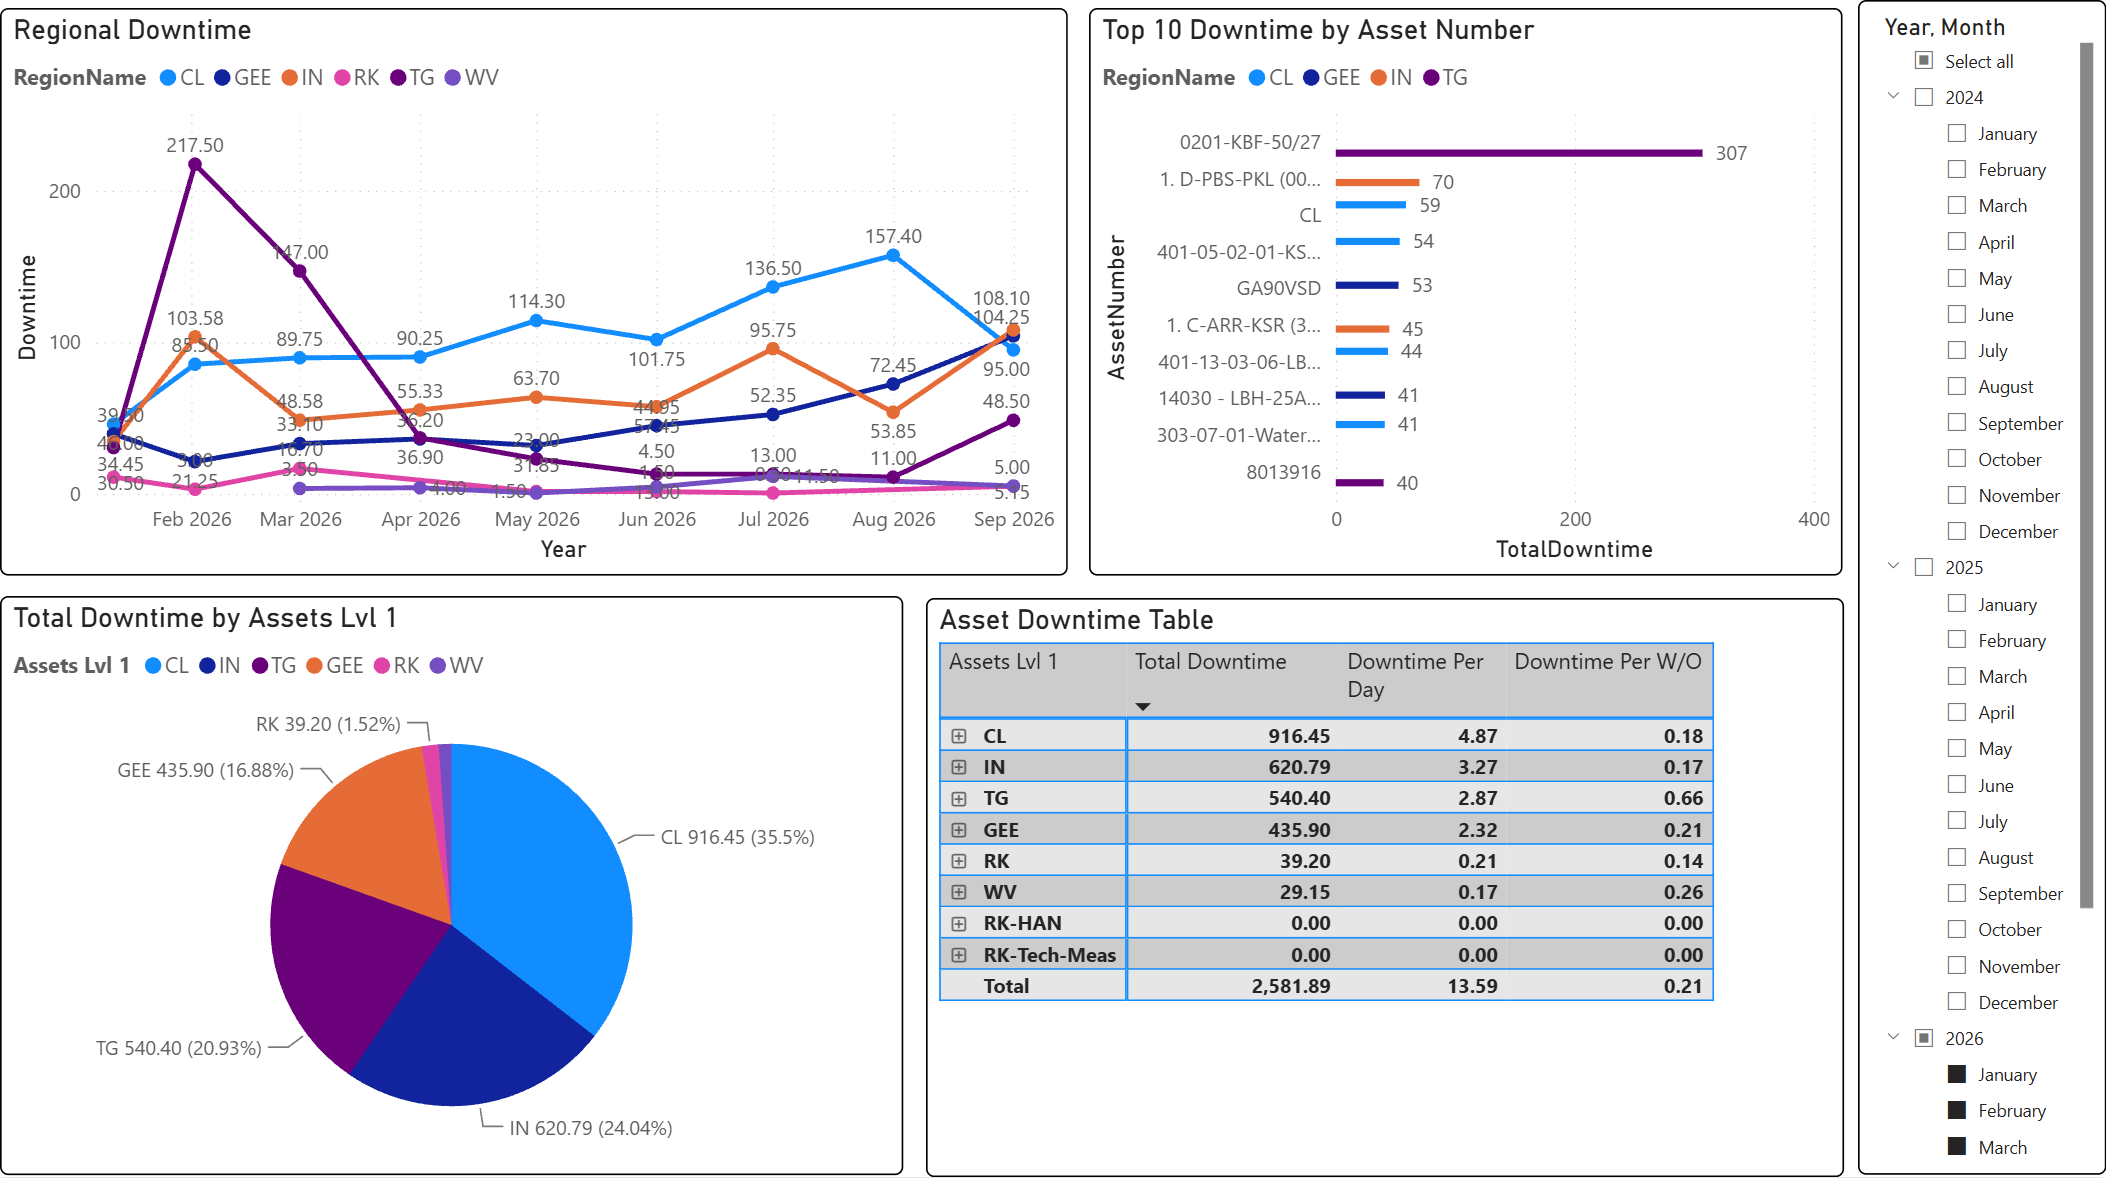
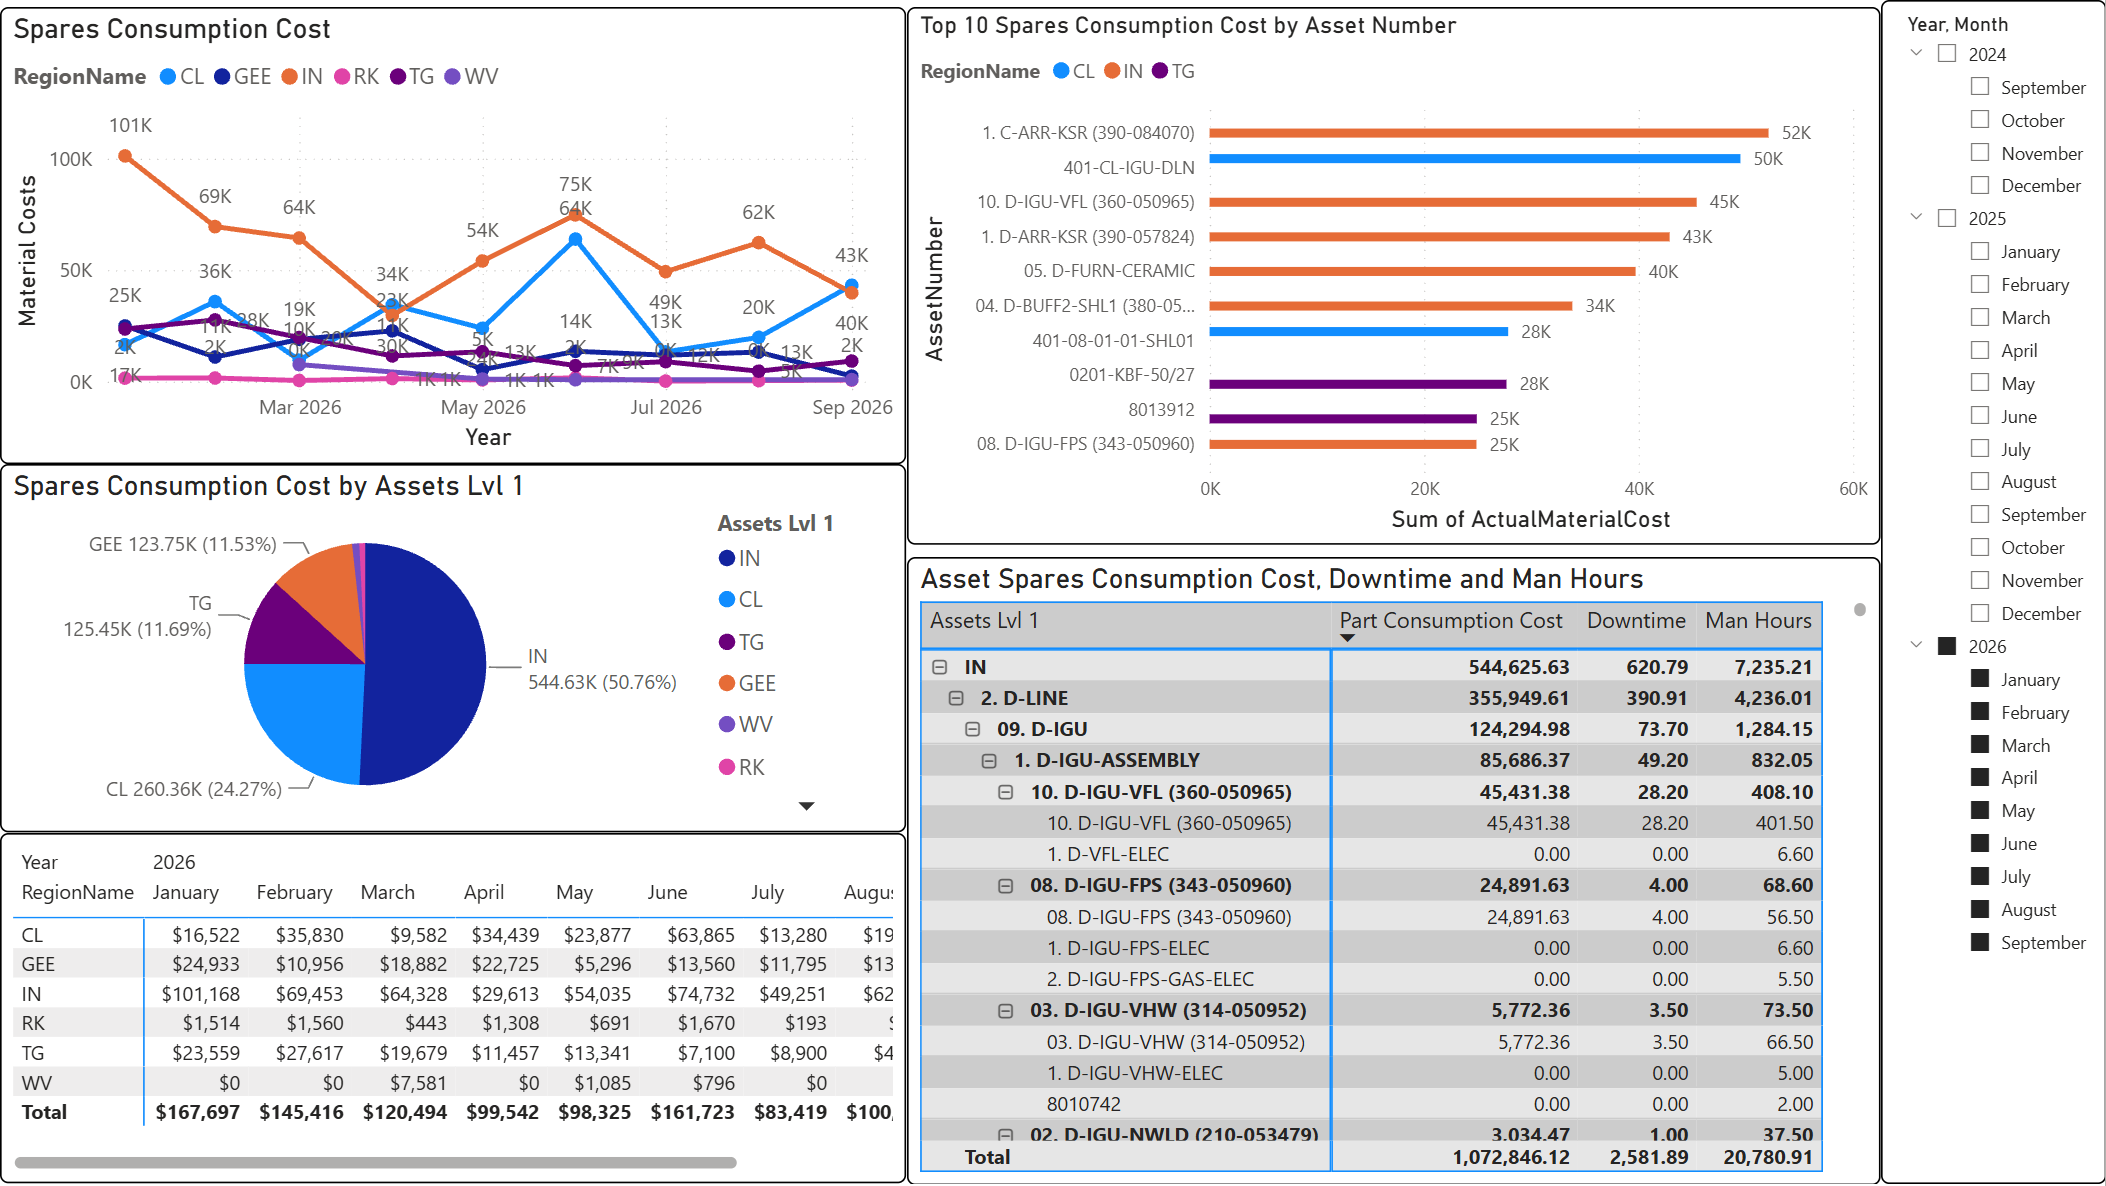
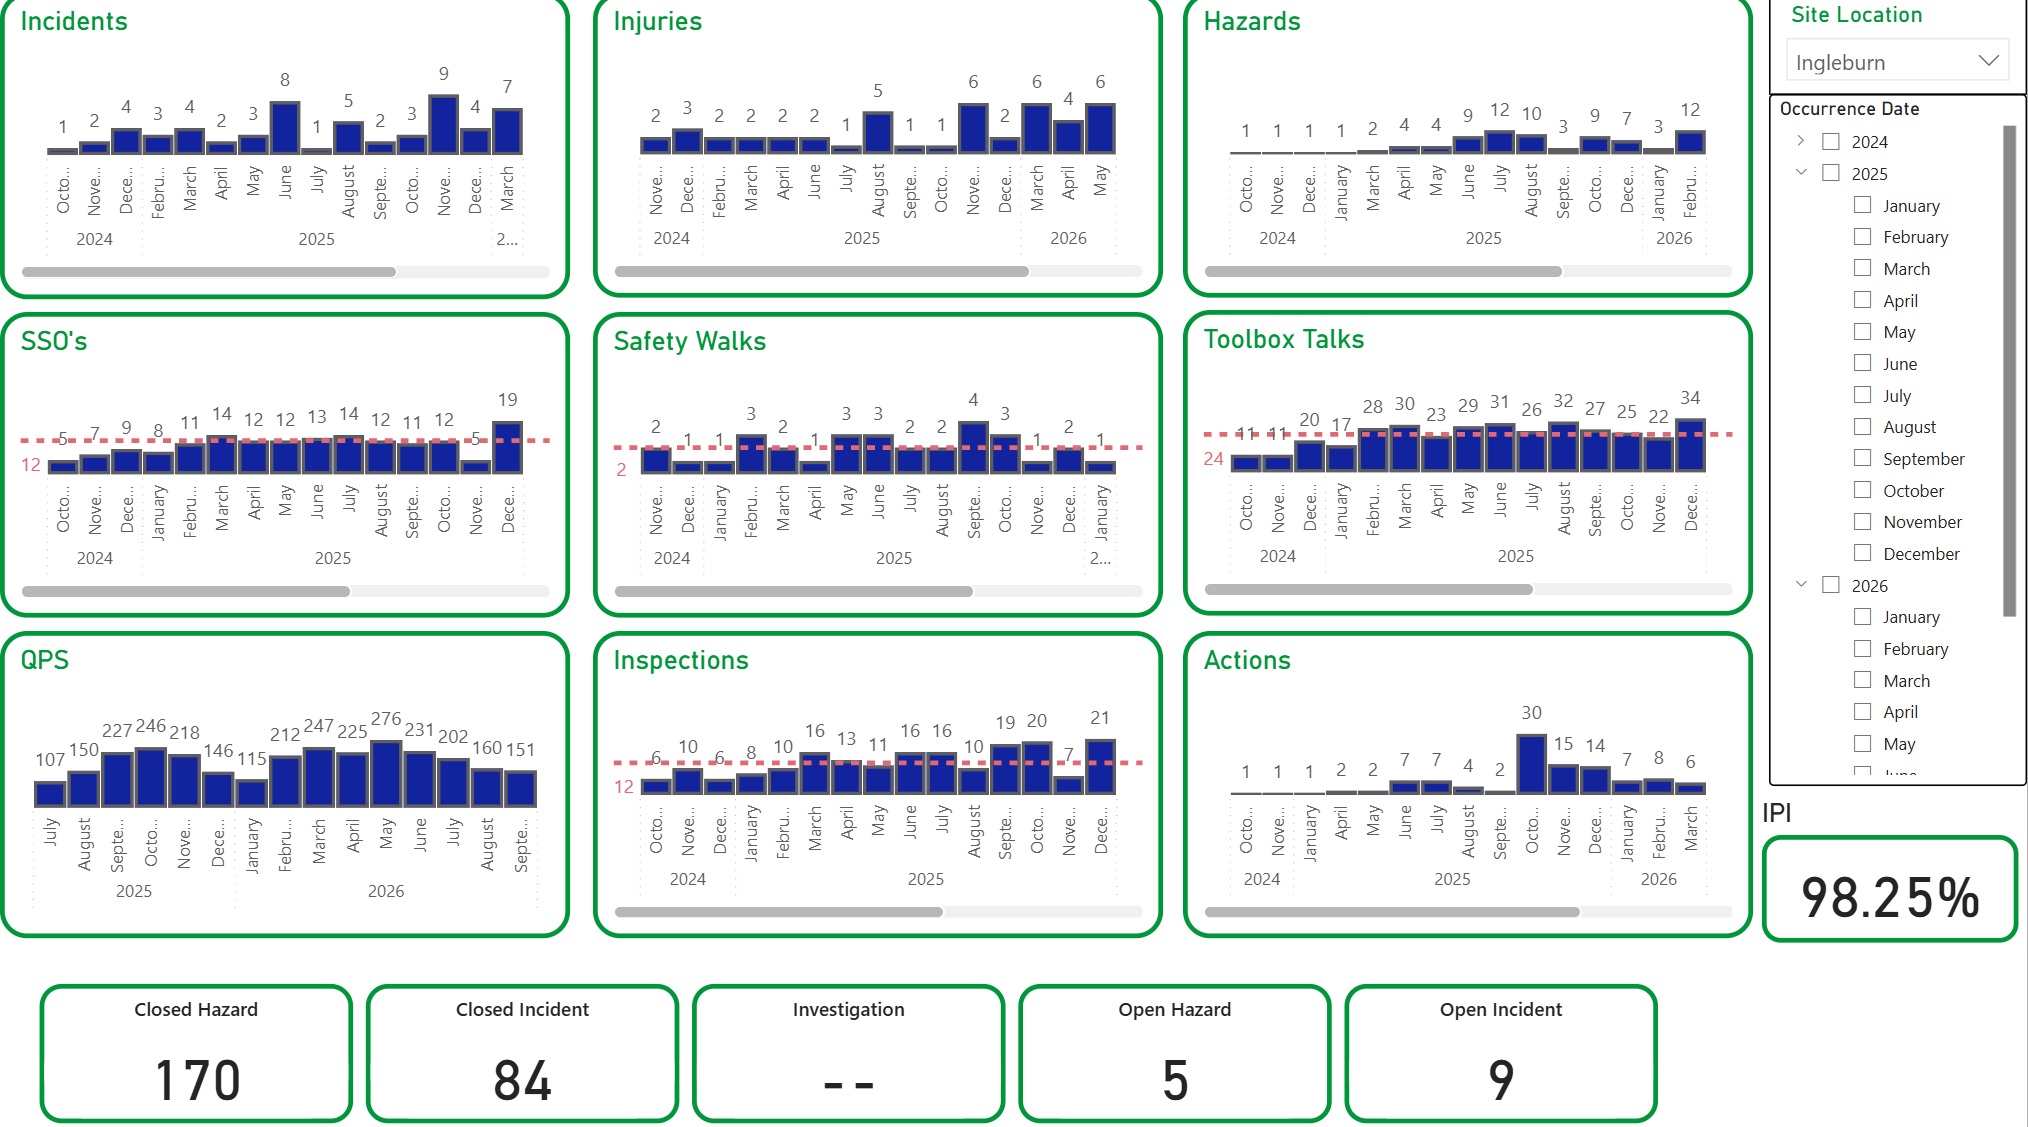
The dashboard collection covers downtime, spare-parts consumption, preventive-maintenance completion and work health and safety. Each view supports a different operational question.
- How is downtime changing over time and across equipment?
- Where is spare-parts consumption concentrated?
- How is preventive-maintenance work progressing?
- What does the maintenance and safety picture look like across sites?
Bring The Operational And Analytical Work Together
The outcome is a maintenance system supported by live reporting: operational records can be explored through focused asset and maintenance views. My contribution spans the rollout, user training and the reporting layer.
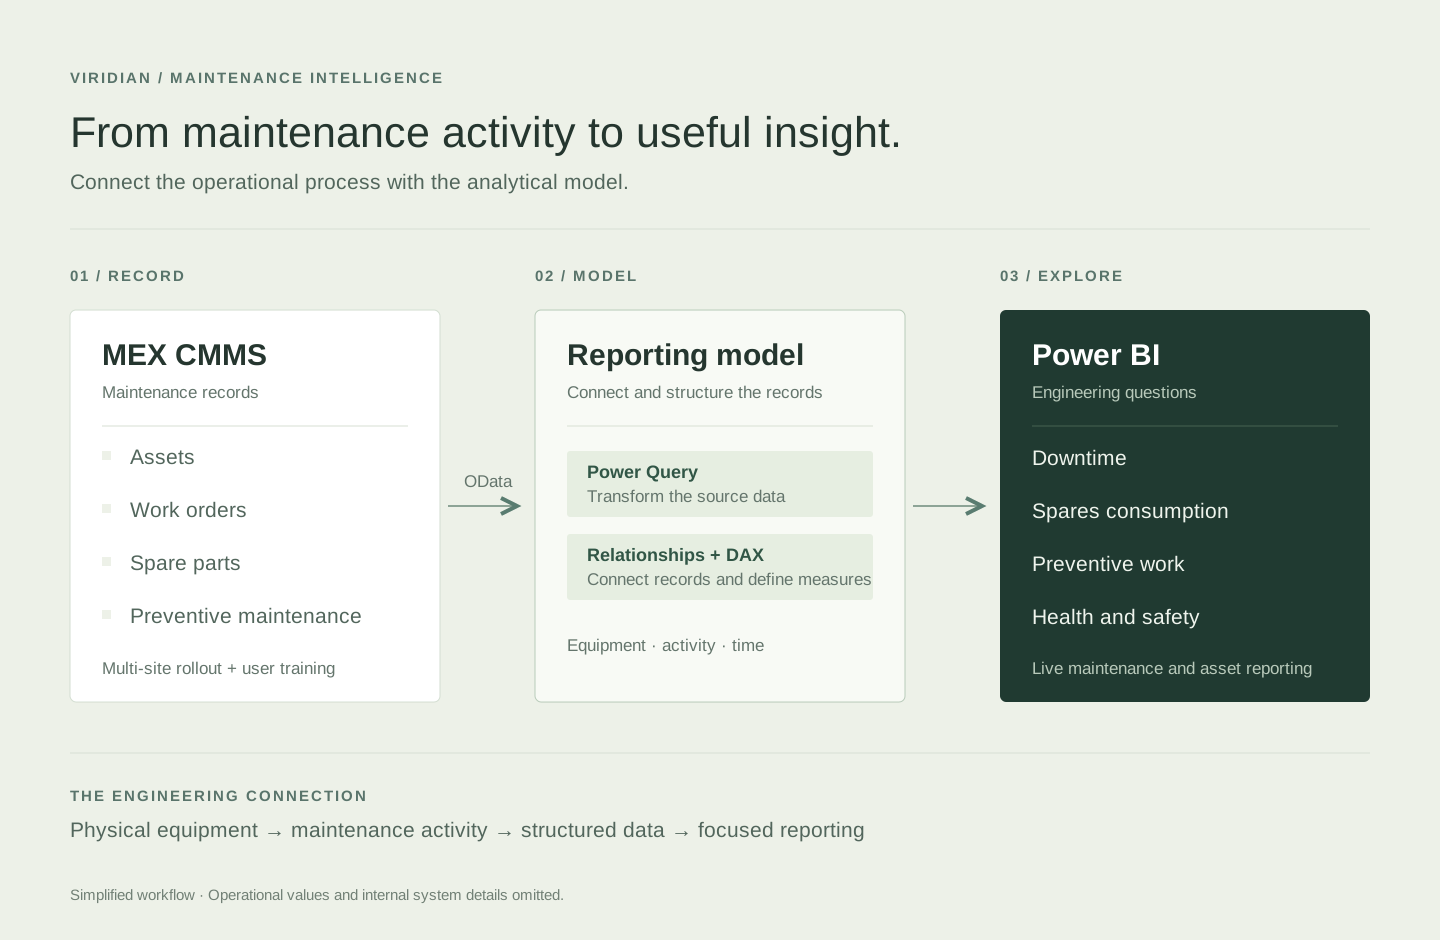
The dashboard views show how these questions are presented, alongside an overview of the reporting workflow.
The Engineering Journey
Organise
Establish assets, work orders, spares and preventive-maintenance workflows in MEX.
Model
Connect and transform records, establish relationships and define reporting measures.
Explore
Build focused Power BI views around maintenance and asset questions.
What This Experience Achieved
The result
A multi-site maintenance-system rollout, user training and live reporting for maintenance and asset analysis.
Technical decisions & tools
OData provides access to MEX data; Power Query and DAX support transformation and analytical measures in Power BI. The simplified diagram describes this at a capability level rather than exposing the internal implementation.
The image collection includes the landing view, downtime analysis, spares-consumption analysis, WHSE reporting and a data-relationship view.