Control Systems Design
Floater Control System
Air levitation, measured plant dynamics and feedback control.
Experience In Practice
Skills Applied
Technical Skills
Soft Skills
Hold A Floater At A Chosen Height
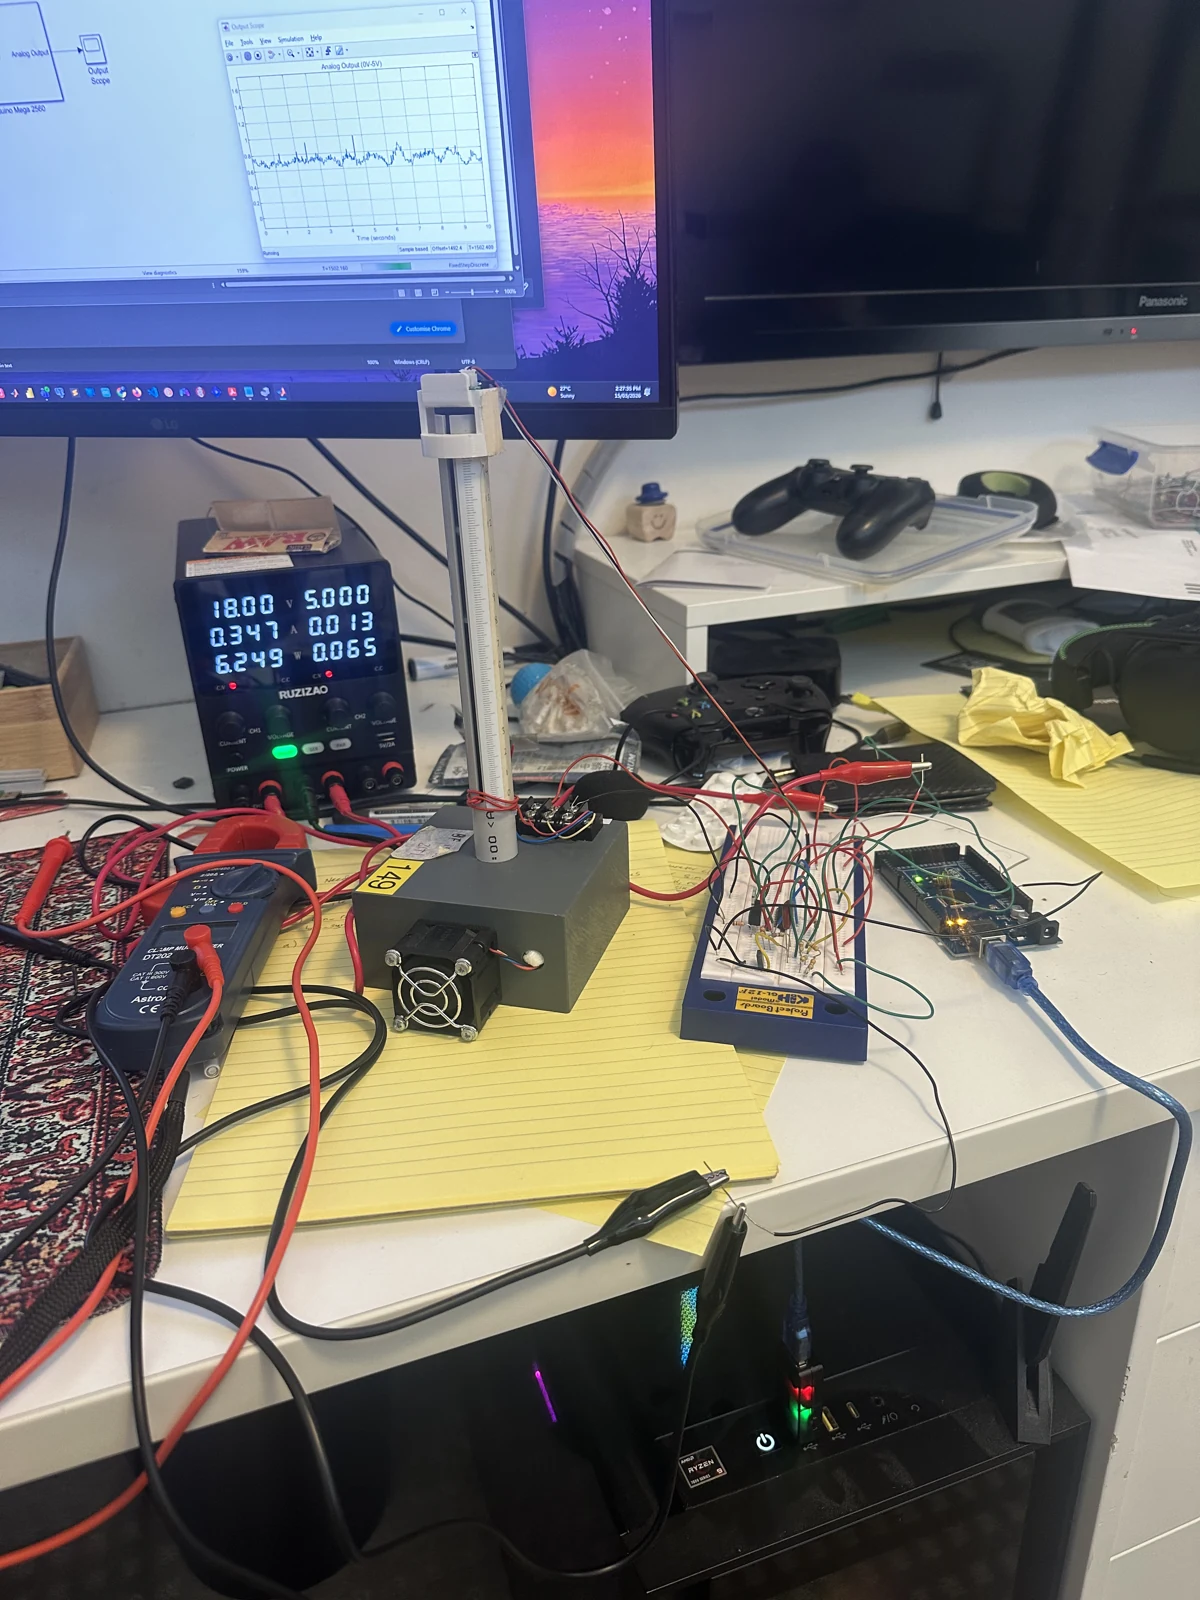
A brushless DC fan pushes air up a slotted vertical tube, suspending a lightweight floater. Increasing the fan drive raises the airflow and changes the equilibrium height; reducing it lets the floater settle lower. The control objective is to hold a selected position and recover when the airflow or floater is disturbed.
A Sharp GP2Y0A51SK0F infrared distance sensor looks down from the top of the tube. Its analogue voltage provides position feedback over a nominal 2–15 cm sensing range. Because tube reflections and the floater surface affect the reading, the rig needs its own measured mapping between position and voltage.
The fan, aerodynamic drag and air escaping through the slot make the complete system nonlinear. A useful linear model therefore describes small changes near a chosen operating point, rather than predicting every height from rest to the top of the tube.
Turn A Digital Command Into Fan Power
The Arduino sends a duty-cycle command to a PWM-to-DC power driver. Filtering smooths the 0–5 V, 7.8 kHz pulse train; the analogue gain and power MOSFET stage turn it into an adjustable fan supply. The driver is designed to map 0–100% duty to approximately 0–12 V.
This separates a low-power microcontroller command from the fan’s power demand. The design balances ripple suppression against response speed: the driver brief targets 1.5–3 ms settling and less than 150 mV peak-to-peak ripple, so the electronics can respond much faster than the mechanical plant.
The Simulink interface scales the Arduino’s 10-bit ADC reading into volts and maps percentage duty into an 8-bit PWM command. The recorded analysis uses a 10 ms sample interval; that 100 Hz acquisition rate is distinct from the IR sensor’s approximately 60 Hz internal update rate.
Find The Useful Operating Range
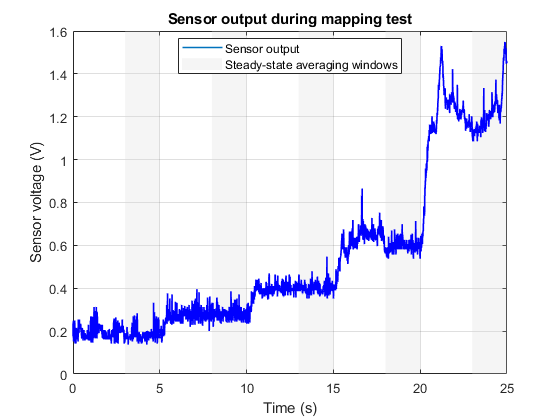
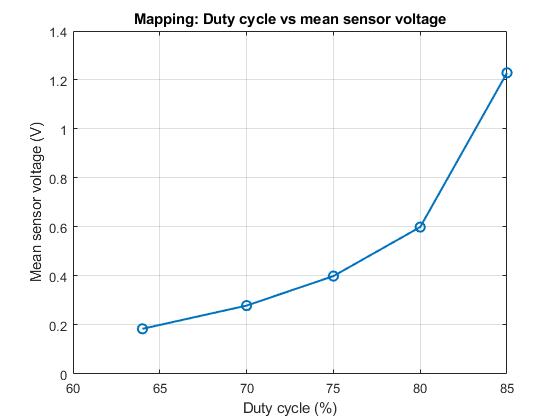
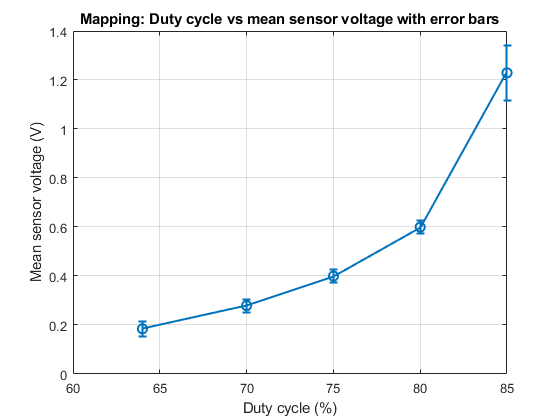
I tested duty-cycle levels of 64%, 70%, 75%, 80% and 85%, then selected settled windows within each step instead of averaging the transient response. The MATLAB script calculates the mean sensor voltage and its standard deviation at each level.
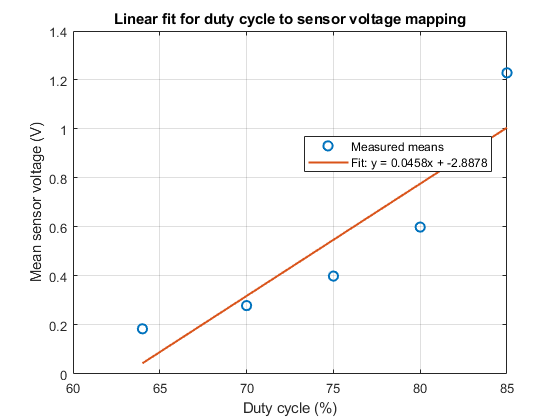
The saved measurements rise from approximately 0.198 V at 64% duty to 1.251 V at 85%. The change is noticeably nonlinear: equal increases in duty do not produce equal increases in sensor voltage. The error-bar plot also exposes measurement variation rather than hiding it behind a fitted line.
The linear-fit figure is a local modelling aid, not a universal height calibration. I used the operating point to separate the steady fan command and sensor reading from the smaller changes needed for identification and feedback.
Identify Dynamics From Repeated Bump Tests
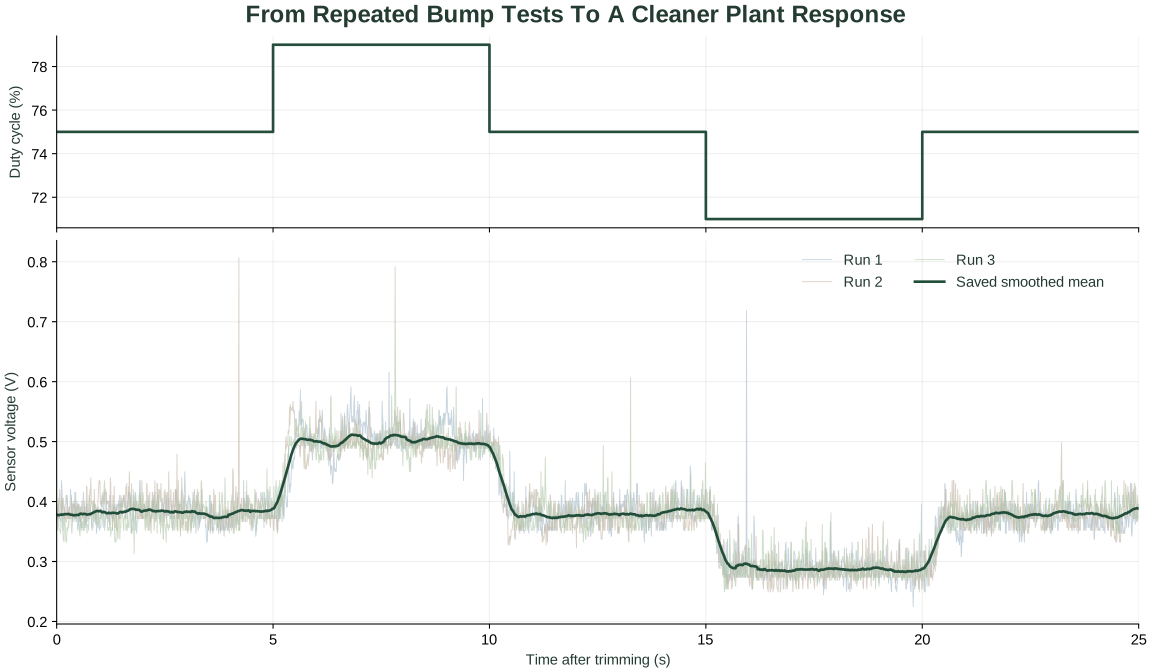
I recorded three repetitions of a stepped duty-cycle input, removed the initial startup interval and aligned the runs on a common time base. Interpolation handles small timing differences; moving-average filtering and averaging reduce the run-to-run variation.
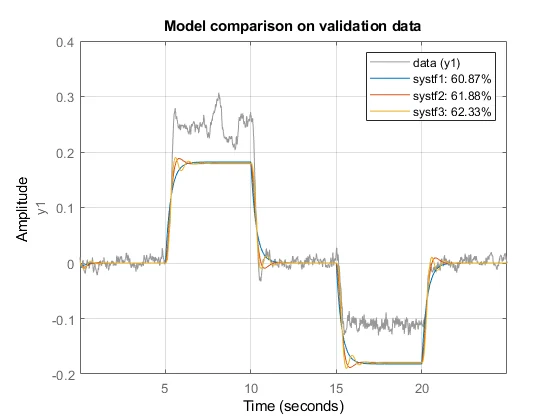
Removing the input and output offsets puts the operating point at zero for the small-signal model. The saved MATLAB analysis compares transfer functions with one, two and three poles and no zeros, then uses zero-order-hold conversion to obtain a discrete model.
The retained model-comparison figure shows fits of approximately 61–62% for that recorded comparison. Increasing model order only slightly improves the match, which makes the remaining noise and nonlinear behaviour important when interpreting simulated controller performance.
Close The Loop Around Position Feedback
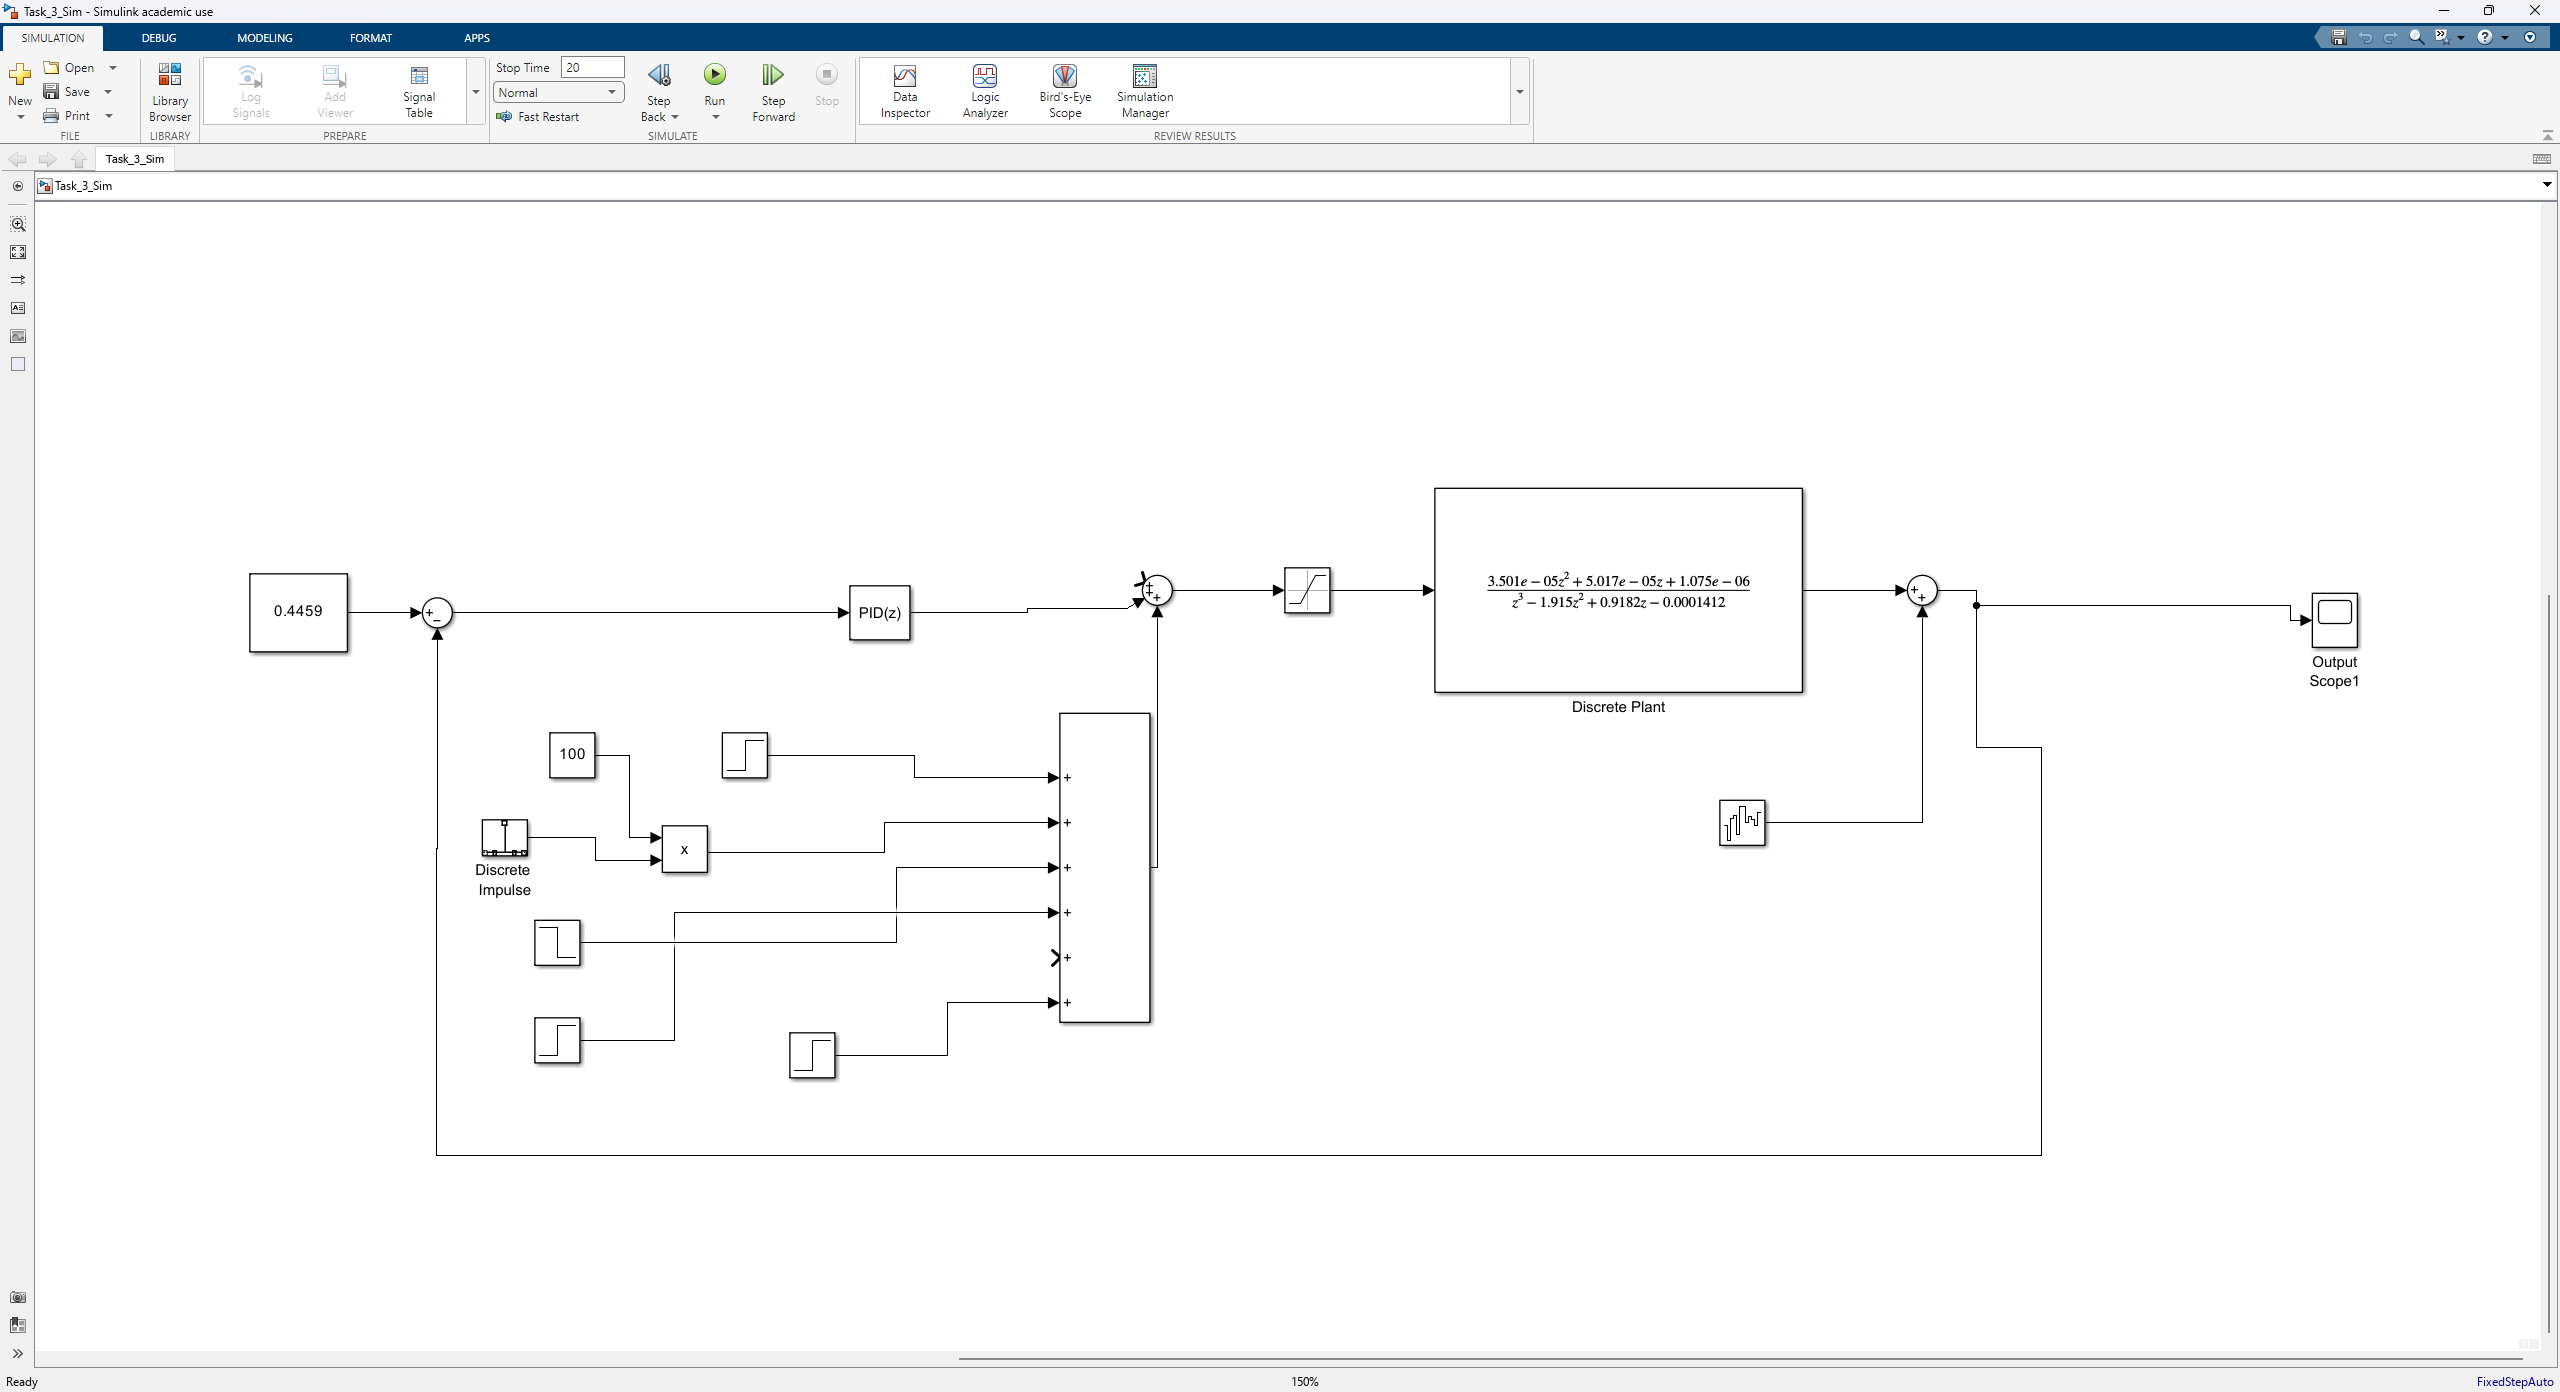
The controller compares the desired sensor reading with the measured reading and adjusts the fan command to reduce the error. An input offset supplies the steady duty needed to levitate the floater, while the controller contributes the positive or negative correction around that operating point.
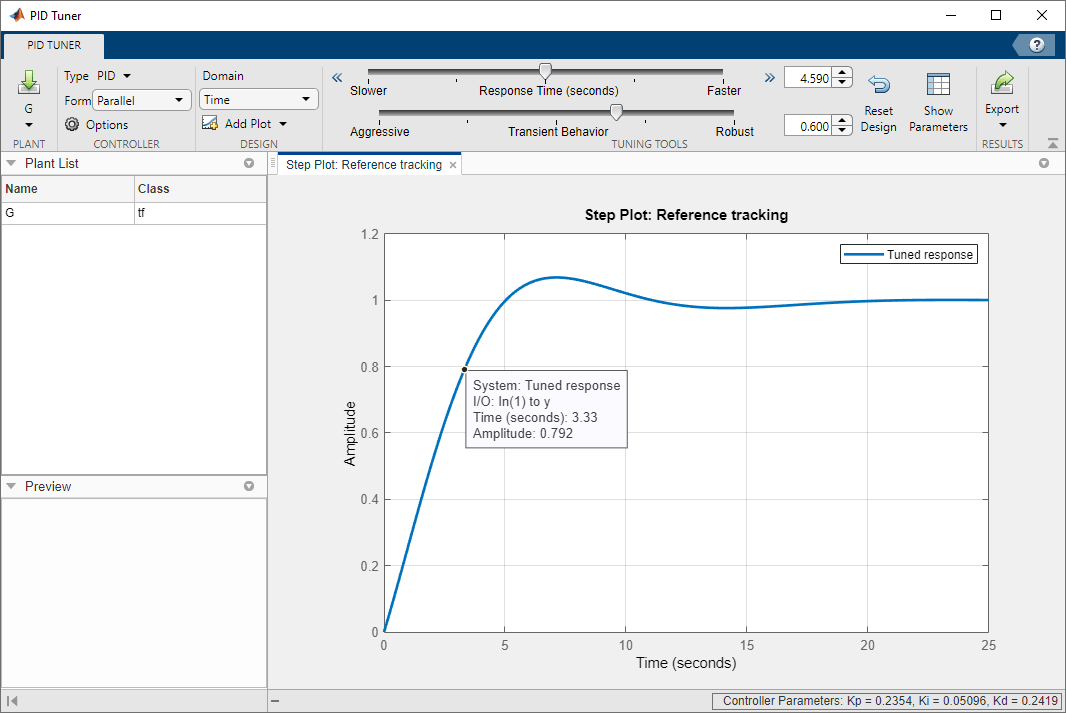
The saved Simulink files explore proportional and PID configurations in continuous and discrete time. The model includes reference changes, input disturbances and measurement noise to examine the trade-off between fast recovery, overshoot, steady-state error and unnecessary control activity.
A 0–100% duty limiter represents the actuator’s physical command range. When the command reaches a limit, increasing the requested correction cannot produce more fan drive; this is one reason simulated recovery must be assessed alongside the rig’s operating range and model accuracy.
Connect The Model To The Physical Rig
The Arduino Mega interface brings actuation, sensing and live measurement into the same workflow used for modelling. The hardware configuration provides the route from recorded open-loop tests to feedback control on the fan-driven rig.
Airflow restrictions, a brief displacement of the floater and small reference changes are useful ways to assess regulation and tracking. The visuals here show the retained measurements and model-development work; the simulation configurations are kept distinct from measured closed-loop performance.
The Engineering Journey
Measure
Map steady sensor response and capture repeated bump tests.
Identify
Compare model order against observed dynamics and measurement variation.
Control
Discretise the plant and evaluate controller configurations in Simulink.
What This Experience Achieved
The result
Connected the physical fan, driver and position sensor to measured plant models and continuous/discrete controller designs, with recorded data showing both repeatability and the limits of a linear approximation.
A Closer Look
Technical decisions & tools
The mapping images are original figures extracted from the saved MATLAB live script. The bump-test figure is replotted from the saved time, duty, three-run response and smoothed-mean arrays; it does not refit the plant or invent a new experimental result.
The identification scripts use settled-window statistics, interpolation, moving-average filtering, offset removal, tfest and zero-order-hold c2d conversion at a 10 ms sample interval. Saved continuous and discrete Simulink models retain controller parameters, disturbance inputs, sensor noise and actuator limiting.
The air-levitation rig was supplied. My work connects its fan and sensor to the driver/interface, experimental characterisation and controller modelling. Driver timing and ripple figures above are design requirements, not newly claimed measurements.